RL-pricing: a reproducibility lab for trading AI





We re-test published trading-AI claims (deep RL, LLM agents, forecasters) under one pre-registered protocol, and publish every verdict next to the authors' reply. That includes the verdicts against our own paper. The instruments are public: a causal backtesting benchmark, a live track scored only on market data that did not exist when a policy was published, and a ledger of decisions committed before each US market open. The reports and the leaderboard are also on the lab's site.
Verdicts
| Report | Claim | Level | Claimed | Ours (95% interval) | Verdict |
|---|---|---|---|---|---|
| r0-wang-zhang-2026 | ddpg-annual-return (annual_return) |
L2 | 55.5% | 24.6% [17.3%, 31.9%] | ✗ does not hold |
| r0-wang-zhang-2026 | ddpg-sharpe (sharpe) |
L2 | 1.38 | 1.16 [0.93, 1.39] | ◐ partly holds |
| r0-wang-zhang-2026 | td3-sharpe (sharpe) |
L2 | 1.37 | 1.10 [0.69, 1.52] | ◐ partly holds |
| r0-wang-zhang-2026 | sac-sharpe (sharpe) |
L2 | 1.33 | 1.23 [1.07, 1.39] | ◐ partly holds |
| r0-wang-zhang-2026 | ppo-sharpe (sharpe) |
L2 | 1.09 | 1.17 [0.90, 1.44] | ◐ partly holds |
| r0-wang-zhang-2026 | a2c-sharpe (sharpe) |
L2 | 0.82 | 1.09 [0.91, 1.27] | ◐ partly holds |
| r0-wang-zhang-2026 | lstm-max-drawdown (max_drawdown) |
L2 | -9.6% | -26.5% [-29.4%, -23.7%] | ? inconclusive |
| r0-wang-zhang-2026 | lstm-sharpe (sharpe) |
L2 | 1.19 | 0.75 [0.39, 1.12] | ? inconclusive |
Verdicts: ✅ holds, ◐ partly holds, ✗ does not hold, ? inconclusive. How a verdict is decided.
| Next | Claim under test | Due |
|---|---|---|
| R1 | FinRL ensemble (Yang et al., ICAIF 2020): Sharpe 1.30 vs the DJIA's 0.47, 2016–2020 | 2026-12-01 |
| R2 | TradingAgents backtest: Sharpe 5.6–8.2 on AAPL, GOOGL, AMZN in 2024 Q1, replicated with a check for whether the models remember that period | 2027-01-05 |
| R3 | TradingAgents run live on the same three stocks for three months, each decision committed before the open (pre-registration) | 2027-02-15 |
Authors get each draft seven days before publication. To nominate a claim,
open an issue titled Nominate: <paper> with the quoted claim and a link to
the code.
How the lab works
- Pre-registered. Each report's test plan is committed before anything runs; the commit time is the evidence that the plan came first.
- Three levels. L1 replicates with the authors' code and setup. L2 re-tests under this repository's protocol: next-open fills, fees, at least five seeds, survivorship-free data. L3 tries new windows and, for anything that can run daily, the live ledger.
- Verdicts by rule: holds, partly holds, does not hold, or inconclusive, decided by thresholds fixed in the pre-registration (rules and template).
- LLM agents only count live. Their historical backtests can be contaminated by training data. The ledger commits each decision before the open, and scoring checks the commit against GitHub's own run records.
- Evidence is committed. Each report ships its per-seed results, input hashes and one command that reproduces them.
R0: our own paper
Full report: reports/r0-wang-zhang-2026/report.md.
Our preprint (Wang & Zhang, arXiv:2609.31870) reported DDPG with a 55.5% annual return and Sharpe 1.38 on 20 large-cap stocks in 2019–2020, with TD3 and SAC close behind. Those are single runs on a universe picked in 2021 from the largest companies, which the paper itself lists as limitations.
We re-ran it three ways, 5 seeds per agent, same 20 stocks, same 2019–2020 window, 0.1% fees:
- Share env + crash rule: the paper's own share-trading environment
(
python main.py --mode train, now with next-open fills), including its default rule that sells everything when a market-turbulence index spikes. - Share env, no rule: the same with
--no-turbulence. - Benchmark: this repository's
paper-2021task (portfolio weights, no hand-coded exits).
Sharpe ratio, mean ± sd over 5 seeds [best seed]:
| Agent | Reported (1 run) | Share env + crash rule | Share env, no rule | Benchmark |
|---|---|---|---|---|
| DDPG | 1.38 | 1.16 ± 0.19 [1.43] | 1.06 ± 0.18 [1.24] | 0.70 ± 0.17 [0.97] |
| TD3 | 1.37 | 1.10 ± 0.34 [1.37] | 1.00 ± 0.30 [1.37] | 0.70 ± 0.21 [1.01] |
| SAC | 1.33 | 1.23 ± 0.13 [1.42] | 1.23 ± 0.18 [1.49] | 0.66 ± 0.26 [0.82] |
| PPO | 1.09 | 1.17 ± 0.21 [1.32] | 0.95 ± 0.21 [1.21] | 0.98 ± 0.04 [1.02] |
| A2C | 0.82 | 1.09 ± 0.15 [1.27] | 0.97 ± 0.15 [1.16] | 1.03 ± 0.01 [1.05] |
| LSTM forecast | 1.19 | – | – | 0.75 ± 0.29 [1.08] |
| 1/N buy and hold | – | 1.10 | 1.10 | 1.11 |
What holds up and what doesn't:
- The 55.5% return does not. The best of the 50 share-environment runs earned 46% a year and the median 26%. Holding the 20 stocks in equal weight earned 29.7%, so the hindsight-chosen universe and the 2019–2020 bull market account for most of the headline.
- The Sharpe ratios are best-of-five, not typical. Values like the reported 1.33–1.38 show up as the best seed for most agents.
- The crash rule is not learning. With it on, all 25 runs were moved to cash on the same five sessions of March 2020 by the environment, not the agent. Switching it off drops every agent's mean Sharpe except SAC's below 1/N.
- SAC is the one survivor, but not a significant one. Without the rule its seed-averaged Sharpe is 1.32 against 1/N's 1.10, alpha 7.5% a year. Over a two-year window that is not significant (bootstrap p = 0.13, alpha t = 1.6).
- The benchmark environment flips the picture. There the same agents trail 1/N. Which difference drives that is open: share counts versus weights, the features, or the share environment's per-trade limits.
Per-seed results, equity curves, commands and the input-data hash are in
reports/r0-wang-zhang-2026/evidence/.
Benchmark findings
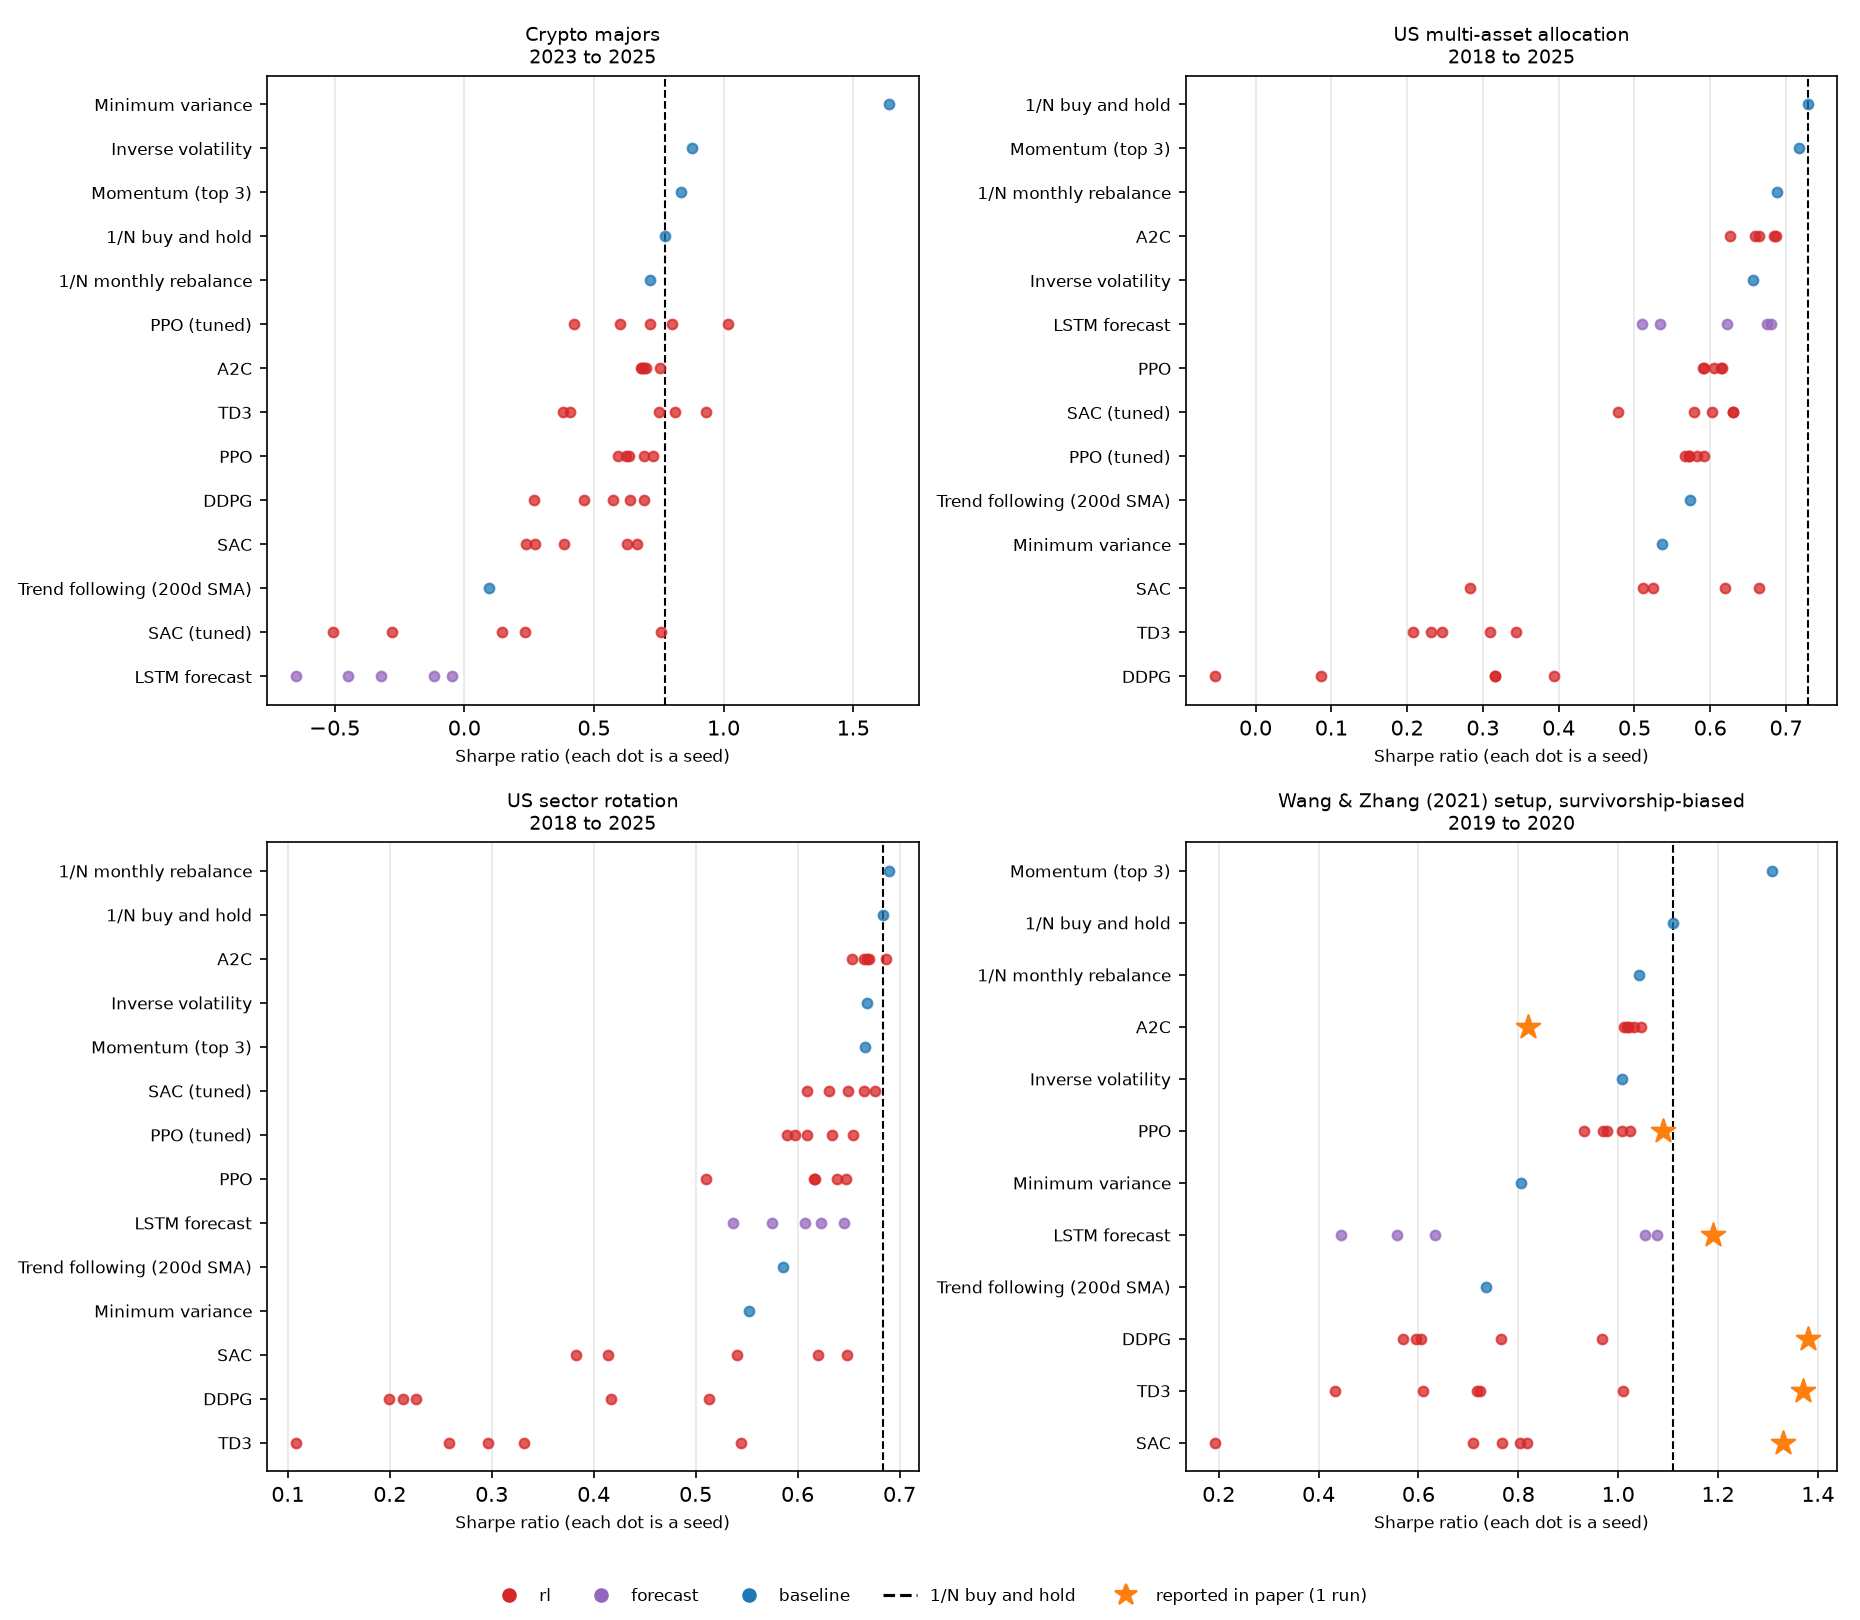
Historical track, test windows 2018–2025 (US ETFs) and 2023–2025 (crypto), Stable-Baselines3 agents with default and tuned hyperparameters, 5 seeds each:
- No learned policy beats 1/N buy-and-hold here. All 30 RL and LSTM entries across the four tasks have a lower seed-averaged Sharpe ratio than holding every asset in equal weight. Only 5 of their 150 individual seeds do better, so cherry-picking one would make a publishable-looking result.
- Tuning doesn't close the gap. A declared sweep of 8 configurations each for PPO and SAC, selected on validation data only, picks configurations that still trail 1/N on every task. SAC's choice helps on the US tasks and collapses on crypto (Sharpe 0.07 ± 0.49). The deflated Sharpe column accounts for the 8 trials.
- The off-policy agents churn themselves to death. SAC, TD3 and DDPG turn over 46–326× their equity per year. On the US tasks their alpha against 1/N is negative, with t-statistics down to −2.8.
- A2C rediscovers 1/N. Its five seeds on US sectors land at Sharpe 0.67 ± 0.01 against 1/N's 0.68: the softmax policy learns to stay close to equal weights.
- The one significant win is not RL. In crypto, long-only minimum variance beats 1/N (ΔSharpe +0.86, bootstrap p < 0.001), mostly by holding the two least volatile coins, BTC (50% on average) and BNB (36%).
Better configurations are what the leaderboard is for: submit one, and state how many you tried.
Leaderboard
| Track | Task | # | Strategy | Sharpe | CAGR | Max DD | ΔSharpe vs 1/N | DSR |
|---|---|---|---|---|---|---|---|---|
| historical | crypto-majors |
1 | Minimum variance | 1.64 | 90.9% | -33.3% | +0.86 (p<0.001) | 1.00 |
| historical | crypto-majors |
2 | Inverse volatility | 0.88 | 40.7% | -46.8% | +0.10 (p=0.089) | 0.94 |
| historical | crypto-majors |
3 | Momentum (top 3) | 0.84 | 37.8% | -47.9% | +0.06 (p=0.401) | 0.93 |
| historical | crypto-majors |
4 | 1/N buy and hold ◆ | 0.78 | 32.7% | -44.5% | – | 0.91 |
| historical | crypto-majors |
6 | PPO (tuned) | 0.71 ± 0.22 | 26.9% | -49.3% | -0.04 (p=0.621) | 0.43 |
| historical | us-multi-asset |
1 | 1/N buy and hold ◆ | 0.73 | 8.9% | -26.6% | – | 0.98 |
| historical | us-multi-asset |
2 | Momentum (top 3) | 0.72 | 9.9% | -23.7% | -0.01 (p=0.506) | 0.98 |
| historical | us-multi-asset |
3 | 1/N monthly rebalance | 0.69 | 8.0% | -25.8% | -0.04 (p=0.827) | 0.97 |
| historical | us-multi-asset |
4 | A2C | 0.66 ± 0.02 | 7.1% | -23.8% | -0.06 (p=0.940) | 0.97 |
| historical | us-sectors |
1 | 1/N monthly rebalance | 0.69 | 11.6% | -36.7% | +0.01 (p=0.449) | 0.97 |
| historical | us-sectors |
2 | 1/N buy and hold ◆ | 0.68 | 11.5% | -35.5% | – | 0.97 |
| historical | us-sectors |
3 | A2C | 0.67 ± 0.01 | 10.3% | -34.3% | -0.01 (p=0.650) | 0.97 |
| historical | paper-2021 (re-evaluation) |
– | Momentum (top 3) | 1.31 | 48.6% | -30.4% | +0.20 (p=0.240) | 0.96 |
| historical | paper-2021 (re-evaluation) |
– | 1/N buy and hold ◆ | 1.11 | 29.9% | -29.4% | – | 0.94 |
| historical | paper-2021 (re-evaluation) |
– | 1/N monthly rebalance | 1.04 | 26.7% | -29.5% | -0.07 (p=0.777) | 0.93 |
| historical | paper-2021 (re-evaluation) |
– | A2C | 1.03 ± 0.01 | 25.1% | -28.2% | -0.08 (p=0.825) | 0.92 |
Full tables: leaderboard/LEADERBOARD.md.
Why trust these numbers
| This benchmark | Common in RL-trading papers | |
|---|---|---|
| Execution | Decide at the close, fill at the next open, proportional fees | Fill at the same close used to decide; often no fees |
| Universe | Fixed ETFs; crypto top-10 by volume before the data starts, delistings included | Today's index members, back-tested into the past |
| Randomness | 5 seeds per learned policy, mean ± sd, every seed plotted | One run |
| Model selection | Validation window before the test; declared trials deflate the Sharpe |
Tuned on the test period |
| Out-of-sample | Live track: frozen policy, scored only on sessions after its public freeze | One fixed historical window |
| Metrics | One implementation for everyone; beta and alpha against 1/N | Per-paper definitions |
The live track is the part nobody can overfit. A policy is fitted on all
data available today and its artifacts are committed with SHA-256 hashes. A
CI job on main then stamps the time the freeze became public
(leaderboard/publications.json, which pull requests may not edit), and
from then on it is scored monthly on sessions that start after that stamp.
The first live scores appear after the next monthly run.
Quick start
Python 3.10 or newer:
git clone https://github.com/BichengWang/RL-pricing.git
cd RL-pricing
python -m venv .venv && source .venv/bin/activate
python -m pip install -e .

rl-pricing bench tasks                       # list tasks
rl-pricing bench run --task synthetic --submission momentum --out-root /tmp/board
rl-pricing bench run --task synthetic --submission ppo --seeds 2 --out-root /tmp/board
rl-pricing bench leaderboard --out-root /tmp/board --no-readme
The synthetic task is offline random walks with no edge by construction.
Real tasks download data on first use (rl-pricing bench data us-sectors)
into datasets/bench/. PPO takes one to two minutes per seed on a laptop CPU.
Submit a policy
A policy maps the history up to today's close to long-only target weights, which fill at the next open. Here is a complete one:
# submissions/low-vol-half/policy.py
import numpy as np

from rl.bench.policy import Policy


class LowVolHalf(Policy):
    """Equal-weight the calmer half of the listed assets."""

    def act(self, view):
        closes = view.history.window(64).close
        vol = np.nanstd(np.diff(np.log(closes), axis=0), axis=0)
        vol = np.where(view.listed & np.isfinite(vol), vol, np.inf)
        keep = np.argsort(vol)[: max(1, view.listed.sum() // 2)]
        weights = np.zeros(len(view.tickers))
        weights[keep] = 1 / len(keep)
        return weights
{
  "name": "Low-vol half",
  "kind": "other",
  "policy": "policy.py:LowVolHalf",
  "trials": 3,
  "authors": ["Your Name"],
  "description": "Equal-weight the half of the assets with the lowest 63-day volatility."
}
Learning policies implement fit(history, validation_start, seed) as well:
train on sessions before validation_start, select on the rest, and set
stochastic = True to be evaluated over several seeds. They also implement
save/load so the frozen live version can be restored. See
rl/bench/policies/sb3.py for a full example.
Set trials honestly to the number of configurations you tried.
Then:
rl-pricing bench validateandrl-pricing bench run --task <task> --submission <id>locally.- Open a pull request with
submissions/<id>/and yourleaderboard/historical/records. CI checks that the submission builds and the baselines reproduce. - On merge, CI freezes the policy on today's data (or publishes your
committed freeze from
rl-pricing bench freeze) and the monthly job scores it live from then on.
Tasks
| Task | Universe | Test window | Fee per side | Why it is survivorship-free |
|---|---|---|---|---|
us-sectors |
9 SPDR sector ETFs | 2018–2025 | 5 bps | all listed since 1998 |
us-multi-asset |
SPY, QQQ, IWM, EFA, EEM, TLT, IEF, LQD, GLD, VNQ | 2018–2025 | 5 bps | all listed since 2004 |
crypto-majors |
top 10 Binance USDT pairs by Q2-2018 volume | 2023–2025 | 10 bps | chosen before the data starts; BCC and EOS delist mid-sample |
paper-2021 |
the 2021 paper's 20 large caps | 2019–2020 | 10 bps | it is not: shown as a re-evaluation, not ranked |
synthetic |
5 random walks | 2018–2019 | 10 bps | offline demo |
Each task trains before its validation window, selects on validation, and
reports the test window. Definitions live in rl/bench/tasks.py.
How scoring works
- Execution (
rl/bench/engine.py): targets set at close t fill at open t+1 with fees solved exactly on traded notional. Weights are long-only and sum to at most one; the rest is cash at 0%. A delisted holding is sold at its last close. RL agents train in a gym environment that uses the sameAccount, so training and evaluation accounting are identical. - Metrics (
rl/bench/scoring.py): Sharpe, CAGR, max drawdown, annual turnover, and beta/alpha against 1/N (Newey-West t). ΔSharpe against 1/N comes with a paired stationary-bootstrap p-value. The deflated Sharpe ratio (Bailey & López de Prado) accounts for declaredtrials. Full definitions are inleaderboard/LEADERBOARD.md. - Records: every run stores its daily equity curve per seed, data
SHA-256, software versions and commit under
leaderboard/, so all metrics can be recomputed.
Data
US tasks use Yahoo Finance prices and dividends, downloaded to a local cache. Yahoo's terms prohibit redistribution, so the repository ships no prices, only derived results. Prices are adjusted for dividends forward from each task's first session rather than taken from Yahoo's adjusted close, whose last digits change between identical requests. A past session therefore keeps its prices as new sessions arrive, and replaying the same window reproduces its data hash; a changed hash means Yahoo revised its history. Crypto uses Binance Vision daily klines, each archive verified against Binance's SHA-256 checksum. Binance Vision data is licensed CC BY-NC-SA 4.0; the crypto results here derive from it, with attribution, for non-commercial research.
Limitations
- Fees are proportional; spread, market impact and borrowing costs are not modeled, and cash earns nothing.
- Daily bars only; adjusted prices model reinvested distributions rather than exact exchange fills.
- Eight-year and three-year test windows are a few market regimes, which is why the live track exists.
- Reference RL agents are untuned and use one feature set
(
rl/bench/features.py); they are a floor, not the best RL can do.
Training toolkit
The original FinRL-style training pipeline (share trading, portfolio
allocation, LSTM forecaster, rolling ensemble via python main.py --mode ...)
is still available and documented in docs/toolkit.md.
Development
pip install -e ".[test,lint]"
python -m pytest        # offline: synthetic data and fixtures
ruff check .
Use type(scope): title for pull request titles. The
PR template asks for a short summary and
verification results.
The site is built from this
repository by mkdocs.yml and deployed on every push to main. To preview it:
pip install -r docs/requirements.txt && mkdocs serve.
Citing
GitHub's "Cite this repository" uses CITATION.cff. The
original study is Wang & Zhang, Deep Reinforcement Learning for Equity
Trading: Benchmarking Actor-Critic Methods with Forward Retraining,
arXiv:2609.31870
(local PDF).
License
MIT; see LICENSE. The training toolkit's environment, preprocessing and training code are adapted from the MIT-licensed FinRL library.